What do the all the statistics mean?
The different figures, rates and measures of risk that are regularly used when discussing stillbirths and neonatal deaths can get confusing very quickly. Along with this, the collection and analysis of statistics for stillbirths and neonatal deaths in the UK is quite complex and is often a source of confusion for professionals and families.
This section seeks to guide you through a series of questions and answers about the statistics Sands uses including what they mean, where they come from, why we use different ones in different contexts and how we use them to help make a difference. There is also a section explaining the different types of risk and how messages around risk can be complicated for individuals to understand, especially when the context around risk messages is not always clearly explained.
FAQ:
Numbers of deaths and mortality rates
Statistics on baby deaths are reported as both numbers and mortality rates. Numbers state how many babies die each year, while the rate shows how many deaths have happened per 1,000 births.
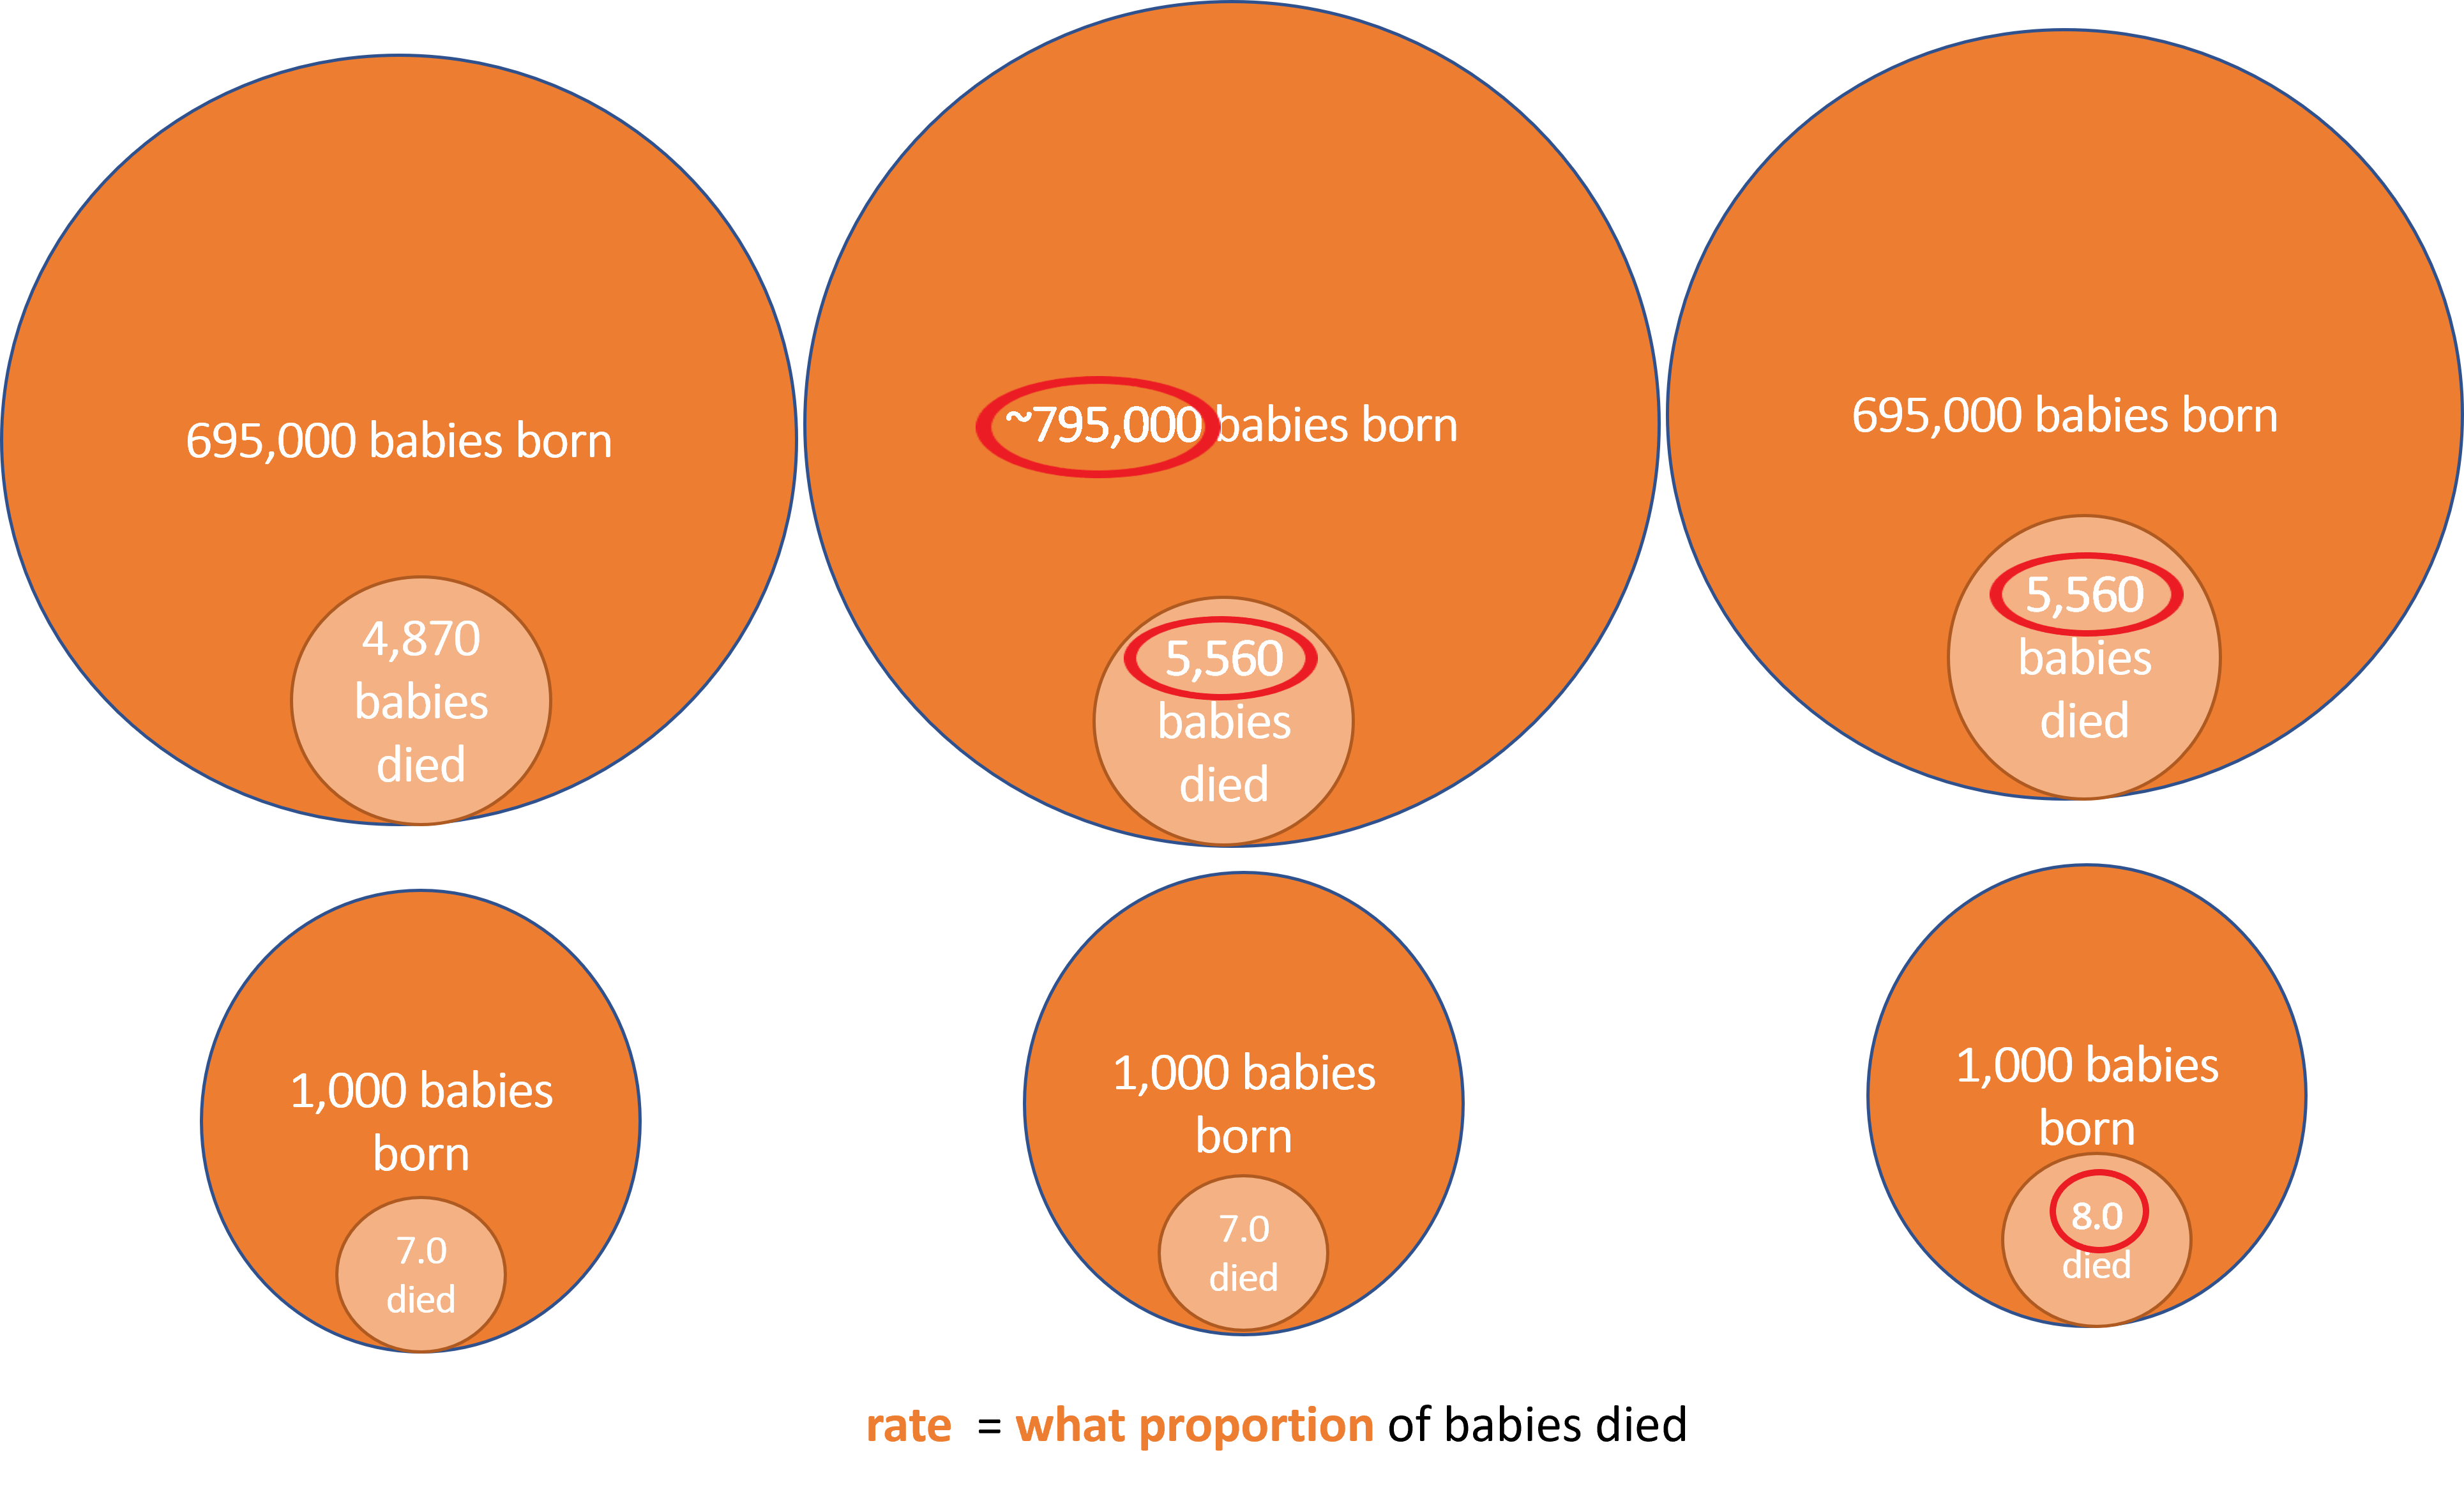
Because the number of births each year fluctuates, simply knowing that the number of deaths has gone up or down does not tell you whether the proportion of babies dying is getting larger or smaller. For example, if the number of births increases, the number of baby deaths can also increase but the mortality rate will stay about the same.
However, if the mortality rate increases or decreases then there is a definite change in the proportion of babies dying, which can be compared year on year to see if things are getting better or worse over time. The image below shows how changes in the number of births and deaths then translates into a change in the rate of baby deaths.
The rates for stillbirths and neonatal deaths are worked out slightly differently. Stillbirth rates are calculated per 1,000 total births, while neonatal death rates are calculated per 1,000 live births. The perinatal death rate (combining stillbirths and neonatal deaths) is calculated on total births.
Who collects the data?
There are two main sources of statistics for baby deaths:
- Deaths notified to the national register for births and deaths, and the stillbirth register (this is when parents register their baby’s birth and death, or stillbirth). This data is collected in each UK country and collated by the Office for National Statistics (ONS)
- Deaths notified by the hospital to the national audit programme which collects data for the whole UK on baby deaths from 22 weeks gestation to 4 weeks of life – the programme is run by MBRRACE-UK
When are the figures published?
The registration data has less detail than the hospital data and is published sooner. Currently, both organisations are looking at ways of reporting this data more regularly so that it is more up to date for each year.
For deaths in a calendar year:
- ONS publishes figures at the end of the following year
- MBRRACE-UK publishes data in the autumn of the following year
What is the difference between ONS and MBRRACE-UK data?
ONS
ONS collates registration data from each of the four UK countries. This includes basic information about the baby (such as gender and date of birth/death/stillbirth) and the parent/s (such as names and age), and a cause of death.
We use ONS figures to monitor trends in mortality, year on year, and to hold governments to account for progress against targets to cut rates of baby deaths.
MBRRACE-UK
When a baby dies between 22 weeks' gestation and 4 weeks of life, the hospital staff complete an MBRRACE-UK notification form which includes more detail about the baby and mother’s health, the care, and cause of death. However, MBRRACE-UK data on stillbirths and neonatal deaths, including causes of death, only includes babies who died on or after 24 weeks' gestation.
MBRRACE-UK publishes the data in an annual report (called the perinatal surveillance report). This includes a summary infographic and Trust/Health Board-level outcomes, alongside maps showing the changes in these outcomes over time (you can find all of this here).
We use MBRRACE-UK data to understand more about factors affecting baby deaths, for example the impact of ethnicity and social deprivation. We can look at trends in outcomes at Trust/Health Board level. The data helps identify where we should be focusing our energies in preventing deaths
You can find the most recent figures from ONS and MBRRACE-UK on the 'How many babies die in the UK' page
You can find more detail about the technical differences around which data are collected and how in this explainer from the MBRRACE-UK teamWhat about statistics for each country in the UK?
MBRRACE-UK collects hospital data on baby deaths on behalf of all four UK countries, and reports for the UK in the annual reports.
Registration data is gathered separately in each UK country. The countries publish their own data on slightly different timetables. ONS then pulls the figures together for the whole UK.
The latest figures and rates data for each country can be found on the 'UK trends over time' page.
Scotland
National Records for Scotland report annual stillbirth and neonatal deaths during the following year.
Northern Ireland
The Northern Ireland Statistics Research Agency collects the registration data. It’s published annually in the Register General’s report, in the following year.
Wales
Registration data for Wales is reported by ONS, alongside figures for England.
England
ONS publish stillbirth figures for England and Wales in the following year. During the pandemic, ONS has reported provisional stillbirth figures sooner than the confirmed figures, to help understand the impact of COVID-19 in pregnancy.
ONS reports neonatal deaths for England and Wales lightly later than stillbirths. This is because it takes longer to ensure the deaths data is complete.
There are different datasets available on the ONS website, reporting different aspects.
How does Sands use statistics about baby deaths?
We work to hold UK governments to account on their and our targets to cut baby deaths, and push for changes that will make maternity and neonatal care safer.
We work strategically with national bodies, for example the Maternity Consortium, and parliamentary groups such as the Health Select Committee and the All Party Parliamentary Group on Baby Loss, raising the issue of safety and inequalities in outcomes.
Sands action has led to a confidential enquiry into Asian baby deaths, to run along an MBRRACE-UK enquiry into black baby deaths. To enhance the enquiries with the perspective of Black and Asian parents’ experiences, we will be canvassing bereaved families to hear and share their views.
Understanding group and individual risks
A risk is the chance of something happening, but understanding risk in the context of pregnancy and baby loss can be difficult.
To have a clearer idea about the chances of pregnancy and baby loss happening to one person or to a group of people, we need to understand how risk is talked about.
While information about risk can be helpful in understanding the overall picture, it cannot tell you if your baby will be one of those who survives or sadly dies. There are many factors that can affect the risk for an individual, and those factors can be complex and sometimes include things that people cannot change. If you are worried about your personal risk, then please speak to your health professional.
There are a few different ways in which risk can be described. We will explain the difference between an individual's risk and the risk of one a whole group compared to another, as these are the most common ways information about pregnancy and baby loss is shared.
We acknowledge that this information may be of little support to those parents who have been sadly bereaved by stillbirth or neonatal death.
But we do hope it is helpful for those who are pregnant or who are planning for a baby.
Comparing Risk Between Groups
It is important to understand which groups are most at risk compared to another group of people.
For example, official statistics show that Black babies are 2x more likely to be stillborn or die as newborns than white babies. This type of comparison is called relative risk. It tells us about the difference between two groups, but not what the risk is to an individual from one of those groups.
This information is used by professionals in many ways including planning how health services should be provided, addressing inequalities, and informing research and policies.
Individual Risk
‘What are the chances of it happening to me?’
Understanding what the risk of stillbirth or neonatal death is for an individual person in a group we use something called absolute risk.
If we look how many times a baby is stillborn or dies neonatally out of 1,000 births:
-
In 2021, 4.97 white babies were stillborn or died as newborns per 1,000 total births. This means that 0.5% of white babies are stillborn or die neonatally and 99.5% survive.
-
In 2021, 10.45 Black babies were stillborn or died as newborns per 1,000 total births. This means that Black babies have a 1% chance of being stillborn or dying neonatally and 99% survive.
So, while Black babies are twice as likely to be stillborn or die neonatally they have a 99% chance of surviving.
The Royal College of Obstetricians and Gynaecologists has more information about understanding risk.